Custom dashboards in Google Analytics
In this article, the first in a new series, I will write about how to make custom dashboards in Google Analytics. I will also come with some suggestions of custom dashboards suited for an e-commerce site.
But first, what is a dashboard? According to Google,
Dashboards can include up to twelve widgets each, and they show the dimensions and metrics that are of interest to you. You can both create your own customized dashboards and import them as described in my quick guide below. The idea is that you get a few simple dashboards as a starting point for measuring how your e-commerce website performs.
It is important for online merchants to keep track of their business. Custom dashboards can both give you a general overview of your business and help to monitor progress in particular areas, such as SEO, SEM or AdWords campaigns. In this article I would like to introduce a custom dashboard that I set up to give an overview of an e-commerce. To download the template, please follow the guide below.
Custom dashboard description: E-commerce overview
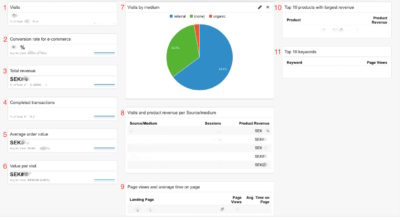
The dashboard itself looks like this:
It includes the following widgets:
Widget 1: Visits
This widget displays the total number of sessions during which a visitor is actively using your website or app. All user information, such as screen displays, events, e-commerce is connected to a session.
Widget 2: The conversion rate for e-commerce
This widget shows the percentage of visits that resulted in e-commerce transactions. Conversion rate is often used as a KPI to measure the effectiveness of an e-commerce site is. Do you know your conversion rate?
Widget 3: Total Revenue
Here you can see the total revenue from transactions on the website and inside the app.
Widget 4: Completed Transactions
A total number of completed purchases on your site
Widget 5: Average Order Value
The average order value
Widget 6: Value per visit
Here you can see the average revenue per session or average in-app revenue for mobile apps. This widget does not include acquisition revenues from app purchase within a marketplace like Google Play.
Widget 7: Visits by Medium
The following widget shows which mediums generate the most traffic to your site in a pie chart.
Widget 8: Visits and Product revenue by Source / Medium
This widget provides a little more detailed view than the previous one: through which sources visitors come to your e-commerce website and the amount of revenue each source is responsible for.
Widget 9: Page views and Average time on page by Landing page
Here you can see most visited landing pages and how much time visitors spend on each of those pages.
Widget 10: Top 10 products with the largest revenues
This one is quite self-explanatory: which of your products sell the most.
Widget 11: Top 10 Keywords
This table shows the 10 keywords that generated the largest number of visits to your site during a selected time period. These are the keywords that visitors used in a search engine to find your site in the search results. The widget excludes the cases when a keyword shows as (not provided) or (not set) in Google Analytics.
How to download this custom dashboard
You can very easily download this template and start using it yourself. Moreover, you do not need to log in to Analytics to see the overview. You can schedule the report to be emailed to you at certain intervals. Just take the following steps:
- By clicking here, you import the template to your Google Analytics account. If you have not yet logged in to your Google Analytics account, do that first. After clicking the link, you need to select a view where you want to use the template. You import only the settings for the dashboard, and the data in it is your own.
- You can email reports with overviews one at a time or schedule send the report at a specific frequency. To achieve it go to the dashboard you are interested in, click on E-mail and under Frequency choose the timing of the e-mail dispatch. By default, recurring emails will be sent for six months. In Advanced Options you can change the interval to anything between one month and one year. When the period has expired, you need to set up the report email schedule again.
Hope that the dashboard is of help to you and your business. Please comment what you thought about it, preferably in a constructive way.
In my next posts I am going to talk about dashboards that cover more specific areas of e-commerce, and I would be happy to hear if you are interested in any particular topic.

 Previous Post