Custom dashboards for E-commerce: Social media
After I published my previous articles, I received several interesting questions about the widgets to use to see how visits from social media affect earnings.
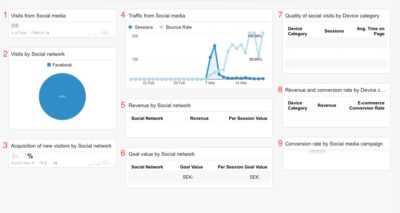
The dashboard that I have compiled below shows whether visitors that come to your site from social media convert though purchases or the goals you have set.
A prerequisite for this dashboard is that an economic value should be assigned to each goal.
Goal value
Assigning a monetary value to a goal gives you a way to compare conversions and measure changes and improvements to your site or app. All goal types except Smart Goals let you assign a value during the setup process. There are special considerations when setting up an Event goal or a goal that involves E-commerce Tracking.
Values for Event goals
There are two ways to set the goal value for an Event type goal:
- Use the Event value as the goal value. This will be whatever is defined in your Event tracking code as the value. Depending on your setup, this might not be a monetary amount. If you haven’t defined an Event value, the goal value will be empty. Change the goal value option to YES in the setup for this configuration.
- Use a goal value. This works like setting a value for other types of goals. Keep the goal value option to NO in the setup for this configuration, and manually set the value.
Values for goals with E-commerce tracking
If you’re tracking a transaction or purchase with the E-commerce Tracking code, leave the Goal Value blank. The actual value of the transaction will appear in the Revenue metric (not the Goal Value metric), and will come from the E-commerce Tracking code in your shopping cart.
Custom dashboard description: Social media
Widget 1: Visits from Social media
This widget sets a context for the whole instrument panel: it shows the total number of visits your website get just from social media, and what proportion of all visits to the page they are .
Widget 2: Visits by Social networks
This pie chart shows which social networks have sent the most traffic to your website, in percent.
Widget 3: Acquisition of New visitors from Social Media
Here I wanted to give an idea of how much new traffic comes from social networks and for this reason I included % new sessions metrics.
Widget 4: Traffic from Social networks
In the following widget, you see how traffic from social media is changing over time. This is set against bounce rate to measure the quality of social traffic: do visitors stay or take off quickly?
The following group of widgets focuses on the results of visits from social media: goals and e-commerce.
Widget 5: Revenue by Social networks
Here is a simple widget with revenues that visitors from different social networks bring in and the value per visit for each source.
Widget 6: Target by Social networks
This widget shows which social platforms generates the most money for your site as a result of goal conversion, not e-commerce.
The data from widgets 6 and 7 combined with the number of visits from individual social networks can help you determine which social platforms you would invest time in. You can identify which social media attract traffic but add little value and media with a high value in relation to the number visit. Widgets can also help you identify which platforms attract visitors in a natural way without you actively using them. Think of what social networks you focus on and adjust your strategy according to the data.
Widget 7: Quality of Social visit by Device category
The social traffic segmented by device category.
Widget 8: Revenue and Conversion rate by Device category
This widget sits close to the previous one: you can see if your visitors make purchases from the same type of devices they visit the website from.
Widget 9: E-commerce conversion rate by campaign
Last widget contains a bar showing campaigns with the highest conversion rate pivoted by social networks. It shows the campaigns in social media that resulted in most visitors to your site converting. E-commerce conversion rate may be exchanged for goal conversion rate if you want to focus on it instead.
How to download this custom dashboard
As usual, you can download the Social media template here to add it to your Google Analytics account.
Tips for easy download:
- Have my blog post in one tab.
- Log into your Analytics account in another tab.
- Click on “download the Social media template here” and then select the which view you would like to add the new dashboard to.
- Done!
Please comment and share my post on Facebook. Please feel free to let me know if there is any widget you would like to see in the social media dashboard.

 Previous Post
 Next Post