Scroll Depth Tracking with Google Tag Manager
Today I would like to talk about how I implemented content and scroll depth tracking in my blog with the help of Google Tag Manager and Google Analytics. One thing I was curious about was if visitors to my blog actually read my posts. Unfortunately it is to most part not tracked by Google Analytics by default. One way to get hold of this information is to measure scroll depth on blog post pages. Visitors who read an article most likely scroll down the page. By measuring how many visitors actually scroll down to the bottom of the article and how fast they do it can give you a good idea about content consumption.
There exist a few ways to track scroll depth. The scroll depth tracking in my blog is based on Justin Curtoni’s advanced content tracking with GA and Simo Ahava’s adaptation of this tracking for GTM with some changes to the tracking code. This article gives a detailed step-by-step guide on how to implement content tracking with Google Tag Manager.
Changes to the script code
- I have changed the time length used to categorise the visitors. The script sets a custom dimension when a user reaches the bottom of the post content. The users are then categorised as a scanner or as a reader based on how fast they have scrolled to the bottom. Since most of my articles are rather short I chose the threshold to be 25 seconds instead of 60. The script collects the time it takes to scroll to the bottom of the content, and I might change the threshold later after I have collected some data. You can adjust the time to reflect the length of articles on your site better in this part of the code:
// Set time to read here
timeToRead = 25;- Originally I made a small change in the script I used for my blog: I set page title as event action and the actions Article Loaded, Start Reading, Content Bottom, Page Bottom as event labels for each article. The script in this article follows the original Junstin’s setup and uses: Article Loaded, Start Reading, Content Bottom or Page Bottom as event action, and page title as event label.
Prerequisites
- The tracking code in this implementation uses jQuery so make sure that jQuery is installed on your website.
- You need to specify the bounds of your content in the script. The code sends an event when the user reaches the bottom of a post. In my blog all the blog posts are wrapped in a <div> marked with ‘.thn_post_wrap’, and I stored this information in the
contentElementvariable. You need to find the container that holds in your blog posts or articles and assigncontentElementvariable with the selector that is specific to your site:
// Change this selector to match the main content element of your site
var contentElement = '.thn_post_wrap';- In your Google Analytics account you need to create three new Custom Metrics and one Custom Dimension for the property where you wish to track scrolling depth. Name the metrics Time to Scroll, Time to Content End and Total Time respectively and name the dimension Reader Type. Take note of index numbers for all the newly created metrics and dimension.
The custom metrics are used to store the time metrics: time to scroll, time to content bottom and time to page bottom.
The custom dimension is used to categorise visitors who have started reading an article as scrollers or readers.
- Data Layer needs to be set up in case you haven’t done it yet.
How to set up Data Layer
To set up your data layer, add the following snippet of code to the head of your page or elsewhere above your Google Tag Manager container snippet:
<script>
  dataLayer = [];
</script>
The above snippet is an empty object that can be populated with information to pass to Google Tag Manager.
- You can also set how far down visitors have to scroll before we start to record that they are reading. It is set to 150 pixels by default:
// # px before tracking a reader
    var readerLocation = 150;
Code implementation
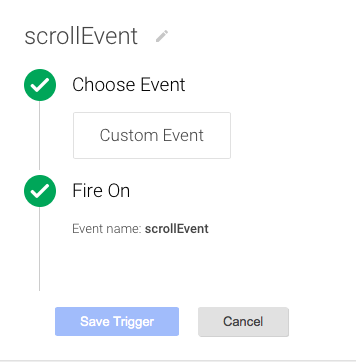
Step 1: In your Google Tag Manager create a new Custom Event Trigger and set Event Name to scrollEvent.
Step 2: Create new Data Layer Variables
These variables will be used to pull information from the data layer. To begin with, create a new data layer variable and name it scrollAction. In the Data Layer Variable Name input field use scrollAction.
In a similar manner create the following data layer variables:
scrollCategory with Data Layer Variable Name scrollCategory
scrollLabel with Data Layer Variable Name scrollLabel
scrollValue with Data Layer Variable Name scrollValue
scrollNonInteraction with Data Layer Variable Name scrollNonInteraction
Time to Scroll with Data Layer Variable Name scrollMetric1
Time to Content End with Data Layer Variable Name scrollMetric2
Total Time with Data Layer Variable Name scrollMetric3
Reader Type with Data Layer Variable Name scrollDimension
The complete list of variables looks like this:
Step 3: Create a new event tag
In the next step you should create a new Universal Analytics tag, choose Event as Track type and fill in the following fields:
Category: {{scrollCategory}}
Action: {{scrollAction}}
Label: {{scrollLabel}}
Value: {{scrollValue}}
Non-Interaction Hit: {{scrollNonInteraction}}
In the section More settings add a Custom Dimension: in the Dimension Value field write {{Reader Type}} and in the Index field use the index this dimension has in your Google Analytics property.
Similarly, in the Custom Metrics section add the three custom metrics you created earlier. Assign {{Time to Scroll}},{{Time to Content End}} and {{Total Time}} as Metric Values and respective metric indexes from GA.
Firing trigger for this event should be scrollEvent trigger you created in the first step.
As a result, your tag should look something like this:
Dimension and Metrics Indexes in the picture are specific for my setup, so remember to use your own ones.
Step 4: Create a new Custom HTML Tag:
Set it to fire on pages where you want to track scroll depth and copy-paste the following code into it.
<script>
jQuery(function($) {
    // Debug flag
    var debugMode = false;

    // Change this selector to match the main content element of your site
    var contentElement = '.thn_post_wrap';

    // Default time delay before checking location
    var callBackTime = 100;

    // # px before tracking a reader
    var readerLocation = 150;

    // Set time to read here
    var timeToRead = 25;

    // Set some flags for tracking & execution
    var timer = 0;
    var scroller = false;
    var endContent = false;
    var didComplete = false;

    // Set some time variables to calculate reading time
    var startTime = new Date();
    var beginning = startTime.getTime();
    var totalTime = 0;

    // Get some information about the current page
    var pageTitle = document.title;

    // Track the aticle load
    if (!debugMode) {
        window.dataLayer.push({
            'event' : 'scrollEvent',
            'scrollCategory' : 'Reading',
            'scrollAction' : 'ArticleLoaded',
            'scrollLabel' : pageTitle,
            'scrollValue' : undefined,
            'scrollNonInteraction' : 1,
            'scrollMetric1' : undefined,
            'scrollMetric2' : undefined,
            'scrollMetric3' : undefined,
            'scrollDimension' : undefined
        });
    } else {
        alert('The page has loaded. Woohoo.');
    }

    // Check the location and track user
    function trackLocation() {
        bottom = $(window).height() + $(window).scrollTop();
        height = $(document).height();

        // If user starts to scroll send an event
        if (bottom > readerLocation && !scroller) {
            currentTime = new Date();
            scrollStart = currentTime.getTime();
            timeToScroll = Math.round((scrollStart - beginning) / 1000);
            if (!debugMode) {
                window.dataLayer.push({
                    'event' : 'scrollEvent',
                    'scrollCategory' : 'Reading',
                    'scrollAction' : 'StartReading',
                    'scrollLabel' : pageTitle,
                    'scrollValue' : timeToScroll,
                    'scrollNonInteraction' : 0,
                    'scrollMetric1' : timeToScroll,
                    'scrollMetric2' : undefined,
                    'scrollMetric3' : undefined,
                    'scrollDimension' : undefined
                });
            } else {
                alert('started reading ' + timeToScroll);
            }
            scroller = true;
        }

        // If user has hit the bottom of the content send an event
        if (bottom >= $(contentElement).scrollTop() + $(contentElement).innerHeight() && !endContent) {
            currentTime = new Date();
            contentScrollEnd = currentTime.getTime();
            timeToContentEnd = Math.round((contentScrollEnd - scrollStart) / 1000);
            if (!debugMode) {
                var readerType;
                if (timeToContentEnd < timeToRead) {
                    readerType = 'Scanner';
                } else {
                    readerType = 'Reader';
                }
                window.dataLayer.push({
                    'event' : 'scrollEvent',
                    'scrollCategory' : 'Reading',
                    'scrollAction' : 'ContentBottom',
                    'scrollLabel' : pageTitle,
                    'scrollValue' : timeToContentEnd,
                    'scrollNonInteraction' : 0,
                    'scrollMetric1' : undefined,
                    'scrollMetric2' : timeToContentEnd,
                    'scrollMetric3' : undefined,
                    'scrollDimension' : readerType
                });
            } else {
                alert('end content section '+timeToContentEnd);
            }
            endContent = true;
        }

        // If user has hit the bottom of page send an event
        if (bottom >= height && !didComplete) {
            currentTime = new Date();
            end = currentTime.getTime();
            totalTime = Math.round((end - scrollStart) / 1000);
            if (!debugMode) {
                window.dataLayer.push({
                    'event' : 'scrollEvent',
                    'scrollCategory' : 'Reading',
                    'scrollAction' : 'PageBottom',
                    'scrollLabel' : pageTitle,
                    'scrollValue' : totalTime,
                    'scrollNonInteraction' : 0,
                    'scrollMetric1' : undefined,
                    'scrollMetric2' : undefined,
                    'scrollMetric3' : totalTime,
                    'scrollDimension' : undefined
                });
            } else {
                alert('bottom of page '+totalTime);
            }
            didComplete = true;
        }
    }

    // Track the scrolling and track location
    $(window).scroll(function() {
        if (timer) {
            clearTimeout(timer);
        }

        // Use a buffer so we don't call trackLocation too often.
        timer = setTimeout(trackLocation, callBackTime);
    });
});
</script>
Step 5: preview and debug the tags. If you are satisfied with the results, publish the container. That’s all!
Hope you found the article helpful. In my next article I am going to talk about some statistics from my blog based on this implementation.


 Previous Post
 Next Post