Analyticsdagarna 2016 in Stockholm (plus a bonus)
On April 20 I visited Analyticsdagarna 2016 conference that was held in the prestigious premises of Hotel Rival. The day was full with many interesting lectures by speakers from such companies as Google, Spotify and Adlibris. In this post I will share a summary of the day’s presentations. There will also be a small bonus at the end of the article.
During the first part of the day we all sat in the same room and listened to keynote speakers from Amazon, Spotify, Adlibris and Google.
I want all the data! with Amazon
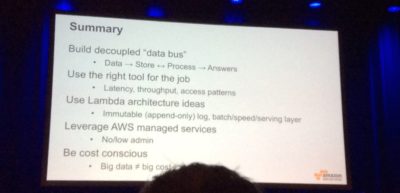
During the day’s opening presentation Max Amordeluso talked about how to structure your data using Amazon Web Services. He mentioned for instance that 95% of the 1.2 zettabytes of data in the digital universe is unstructured and 70% of these 1.14 zettabytes is user generated content.
Analytics has grown up with Spotify
Fredrik Johansson from Spotify told how the use of analytics in the company has changed over the years and how to build the value of your own data. According to him analytics is not the same thing as analysis and to build a data-first company is much more than crunching data.
Data is like oil back in the days – it’s a natural asset.
With the mission to make Spotify a data-first company the analytics has grown from a support function to analys. Analytics has mainly gone through three different stages over the past 5 years:
It started as an ad-hock based strategy when all incoming requests were added to a backlog and prioritised on a daily basis.
Stage two was a fully centralised organisation with one Analytics department. Sub functions within the department mirrored the rest of the organisation.
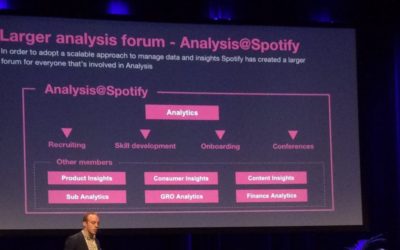
Today Analytics@Spotify has become an analysis forum across the entire company. Its core lies in the Analytics function.
Fredrik’s tip was to adopt a scalable approach to managing data and insights because analysis happens everywhere, not only in Analytics. He also thought it was important to help people become their own analyst instead of being the bottleneck in the process.
To dare choose and choose right with Adlibris
Anna Stjernströms and Rubie Oliphant Lodin from Adlibris presented a project they had been working with recently: creating campaign sites for craft products. During the project they tested a model with a focus on inspiring content and more editorial content. To evaluate the model, the team measured the following:
- Time on Page: the longer the user stays on the page, the greater the interest is
- Scroll: the longer the visitor scrolls down, the greater the interest is
- Hot spots and click: what was most interesting?
The editorial model turned out to work as fine for crafting products as for books.
Micro-moments with Google
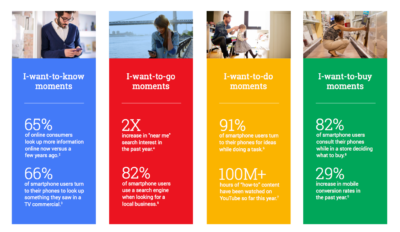
Micro-moments according to Magnus Friberg from Google is a new type of consumer behaviour.
mi∙cro-mo∙ment
1. A moment when we act on a need – a need to learn something, do something, discover something or buy something.
2. An intent-rich moment when decisions are being made or preferences being shaped.
To take advantage of the new consumer behavior, we should follow these steps:
- Identify the Micro-Moments
- Build Frictionless Experience
- Activate Relevant Marketing
- Measure the Value
But how can we connect all micro-moments to be able to measure the moments that are important?
- Measure across screens: account for multi-device behaviour, make sure mobile gets credit for call conversions and measure all actions that indicate intent
- Measure across channels: measure how digital influences offline behaviours and how different marketing channels drive value throughout the customer journey
- Breakdown silos: nix the silos and create closer collaboration
An afternoon at Analyticsdagarna with Hemnet, Usability and Avanza
After lunch the audience split because two tracks were offered: a government and a business track. I chose to follow the trail of presentations by private companies.
During the first presentation in the afternoon Dennis Stenberg from Eniro talked about how web analytics is linked to the company’s aims to contribute to the living neighbourhoods and to help its users to build relationships locally. Eniro places more weight on calls to a company rather than the clicks to the company’s web site when it presents local suggestions in the search among other things.
Source: Twitter @SuzanHLindberg
With the personalization of search results Eniro would also like to achieve its vision to be “The symbol of local discovery” and “Contribute to living neighbourhoods.
After that Maria Sunnergårdh Nylund presented how Skanska has grown from an analog business to mobile first. Focusing on the customer, Skanska has started working on publishing of web content, customizing search engine marketing and tracking of customer behavior. As a result of this strategy, the share of print, for example, fell by 80% between 2012 and 2016. Today Skanska continues to invest in mobile-adapted internal and external systems as well as programmatic buying.
In his presentation Christian Viklund from Hemnet shared insights into swedes’ home surf. For example, almost half (45%) of surfing on Hemet’s site happens during work-hours and is largest after dinner. Christian also gave some examples of how data-driven work resulted in higher business value. For example, by adding the ability to see the travel times to and from a residential objects with different means of transport Hemnet has gained new insights into target means of travel.
Some of Christian’s take-outs about useful web analytics are:
- Start early!
- Define purpose / benefit / goal of your analysis
- Think about relevance!
- Inform – visible purpose.
- Make available to “everyone”
- Customize for knowledge
Daniel Rounds from Usabilla talked about how to combine quantitative data with qualitative insights for conversion optimization. Analytics shows you what is happening on your website and customer feedback shows why it happens. Daniel also gave three tips for building good customer surveys:
- Keep it short: 3 questions per page maximum
- Keep it real: fire and humanize your language
- Keep it relevant: conditional questions
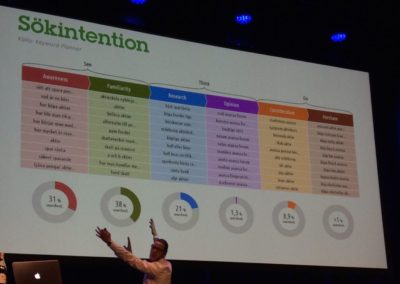
The day’s final presentation was held by Karl Skarman and Alexander Boman from Avanza. They work a lot with such tools as Google Adwords, DoubleClick and Convert.com. All the data is then collected in Google Analytics to form a better picture of their customers by means of, for example, the User ID. But how can we get our customers to convert? Ask customers themselves. To better understand customer conversion trip Avanza separated keywords into different groups based on user search intention. Then they analyzed the search volume based on intent and area.
One of the conclusions was that the keywords related to stocks and mutual funds had the highest search volume among customers close to conversion.
Bonus – a very simple dashboard
If you would like to see how much traffic comes from Eniro to your site in your Google Analytics, you can download this custom dashboard for GA. The instrument panel looks like this:
In it you can see how many visits your website received from Eniro, how long a visit is and how many of visitors from Eniro have converted, in percent. To install the dashboard you need to: 1. be logged into your Analytics account in browser, 2. click on the link above and then save 3. Done!
I’ve even made a few other dashboards that you can download just as easily, read more here.


 Previous Post
 Next Post

Hey there! This is my 1st comment here so I just wanted to
give a quick shout out and tell you I genuinely enjoy reading your articles.
Can you recommend any other blogs/websites/forums that go over the same
topics? Thanks!